I Read All 471 of My Claude Code Sessions: Where 6 Billion Tokens Actually Went
97% of my tokens were cache reads, so my cache looked healthy. Weighed by price, the 3% that were cache writes cost almost as much as all the reads, and 94% of the big rewrites came after a cache had expired from idle time, mostly when I went back to a session or a finished subagent.
On October 21, 2026, a post on X asking what was going on with Claude Code usage took off. The author said they had never run out of usage like this on any model, and that it was "draining 5x faster." Anthropic's Boris Cherny replied "No changes on our end," and later that the team was digging into it. As I write this on October 23, there is no published cause.
I can't see how the plan meter weighs my traffic. I can see every request Claude Code made on my machine, though, because the transcripts sit on disk. So I measured one week of my own usage: 471 sessions, 21,449 API calls, 6.15 billion tokens. The headline number everyone quotes, the cache hit rate, turned out to be the wrong one to watch.
Who this is for: heavy Claude Code users who want to know where their usage goes, and anyone running subagents or long sessions who has never looked at the token mix underneath.
One caveat up front, and I'll repeat it: everything below counts tokens and prices them at Anthropic's published API rates. A subscription plan meters usage its own way, and Anthropic hasn't published how plan limits weigh cache reads, cache writes and output. This guide can't tell you why anyone's limit drained. It shows you how to see your own mix.
How do you measure your own Claude Code usage?
On October 23, 2026, I ran Anthropic's session-report plugin over seven days of local transcripts and got 471 sessions, 21,449 API calls and 6.15 billion tokens. Claude Code already writes every request's token usage to ~/.claude/projects, including subagent transcripts, so the data is on your disk right now.
The plugin lives in the official marketplace:
/plugin install session-report@claude-plugins-official
/session-report
It writes an HTML report you can sort and expand. Under the hood it runs a Node script, analyze-sessions.mjs --json --since 7d, that does the fiddly part: a streamed response is logged as several entries that share one request ID, and a resumed session can replay old history into a new file. If you write your own counter, keep exactly one usage record per request ID, or you'll double count.
My week, from the plugin's JSON:
| Measure | Value |
|---|---|
| Sessions | 471 |
| API calls | 21,449 |
| Input tokens | 6.12B (97.2% cache reads) |
| Output tokens | 21.6M |
| Subagent runs | 688 (1.96B tokens, 32% of all tokens) |
| Calls that wrote more than 100K uncached tokens | 223 |
That table reads like a well-tuned setup. 97% cached sounds like the cache is doing its job. It is doing its job, and that's exactly why the number tells you so little.
Why is "97% cached" the wrong number to watch?
In my week, cache reads were 96.9% of all tokens but about 46% of the cost at API list prices. Cache writes were 2.8% of tokens and about 38% of the cost. Output was 0.4% of tokens and about 16%. Token share and cost share draw two different maps of the same week.
The reason is the price ladder. These are Anthropic's published rates for Claude Opus 5.5, per million tokens, as of October 23, 2026:
| Token type | Price | vs. base input |
|---|---|---|
| Cache read | $0.20 | 0.05x |
| Base input (uncached) | $4.00 | 1x |
| 5-minute cache write | $5.00 | 1.25x |
| 1-hour cache write | $8.00 | 2x |
| Output | $20.00 | 5x |
A 1-hour cache write costs 40 times what a cache read costs. So a session holding 500,000 tokens of context pays about $0.10 to re-read it on the next turn, and about $4.00 to write it again from scratch. One rewrite costs the same as forty reads of that same context.
So I priced every request in the week by its own model and token types. The session-report plugin counts tokens, not money, so I wrote a small script to weigh them. It keeps one usage record per request ID and splits cache writes by their time-to-live, because transcripts record that split:
#!/usr/bin/env python3
"""Weigh Claude Code token usage by API list price (not plan quota)."""
import glob, json, os, sys
from collections import defaultdict
from datetime import datetime, timedelta, timezone

# USD per million tokens: (input, output, cache read), from Anthropic's pricing
# page on 2026-10-23. Longer model IDs first: matching is by prefix.
PRICES = {
    "claude-opus-5-5": (4.00, 20.00, 0.20),
    "claude-sonnet-5-5": (2.00, 10.00, 0.10),
    "claude-haiku-5-5": (0.10, 0.50, 0.01),  # under-prices prompts over 100K
    "claude-fable-5-1": (10.00, 50.00, 0.25),
    "claude-opus-5": (5.00, 25.00, 0.50),
}
days = float(sys.argv[1]) if len(sys.argv) > 1 else 7
since = datetime.now(timezone.utc) - timedelta(days=days)

best = {}  # request id -> (model, usage); keep the record with the most output
for path in glob.glob(os.path.expanduser("~/.claude/projects/**/*.jsonl"), recursive=True):
    with open(path, errors="replace") as fh:
        for line in fh:
            if '"usage"' not in line:
                continue
            try:
                e = json.loads(line)
            except ValueError:
                continue
            msg, rid, ts = e.get("message") or {}, e.get("requestId"), e.get("timestamp")
            u = msg.get("usage") if isinstance(msg, dict) else None
            if not (u and rid and ts):
                continue
            if datetime.fromisoformat(ts.replace("Z", "+00:00")) < since:
                continue
            if rid not in best or u.get("output_tokens", 0) >= best[rid][1].get("output_tokens", 0):
                best[rid] = (msg.get("model", "?"), u)

tokens, cost, unpriced = defaultdict(int), defaultdict(float), defaultdict(int)
for model, u in best.values():
    cc = u.get("cache_creation") or {}
    w1h = cc.get("ephemeral_1h_input_tokens", 0)
    parts = {
        "uncached": u.get("input_tokens", 0),
        "write_1h": w1h,
        "write_5m": u.get("cache_creation_input_tokens", 0) - w1h,
        "read": u.get("cache_read_input_tokens", 0),
        "output": u.get("output_tokens", 0),
    }
    price = next((p for k, p in PRICES.items() if model.startswith(k)), None)
    if price is None:
        unpriced[model] += sum(parts.values())
        continue
    inp, out, rd = price
    rate = {"uncached": inp, "write_5m": 1.25 * inp, "write_1h": 2 * inp, "read": rd, "output": out}
    for kind, n in parts.items():
        tokens[kind] += n
        cost[kind] += n * rate[kind] / 1e6

t, c = sum(tokens.values()), sum(cost.values())
for model, n in unpriced.items():
    print(f"no price row for {model}: {n / 1e6:,.1f}M tokens left out")
if c == 0:
    sys.exit("nothing priced: add a PRICES row for your model")
print(f"{len(best)} requests, {t / 1e6:,.0f}M priced tokens, ${c:,.0f} at list price")
for kind in tokens:
    print(f"{kind:9} {100 * tokens[kind] / t:5.1f}% of tokens  {100 * cost[kind] / c:5.1f}% of cost")
Run it with python3 weigh.py 7 for the last seven days. On my week it matched the plugin to within 0.1% on request count and total tokens, and it put the week at roughly $2,500 at API list price.
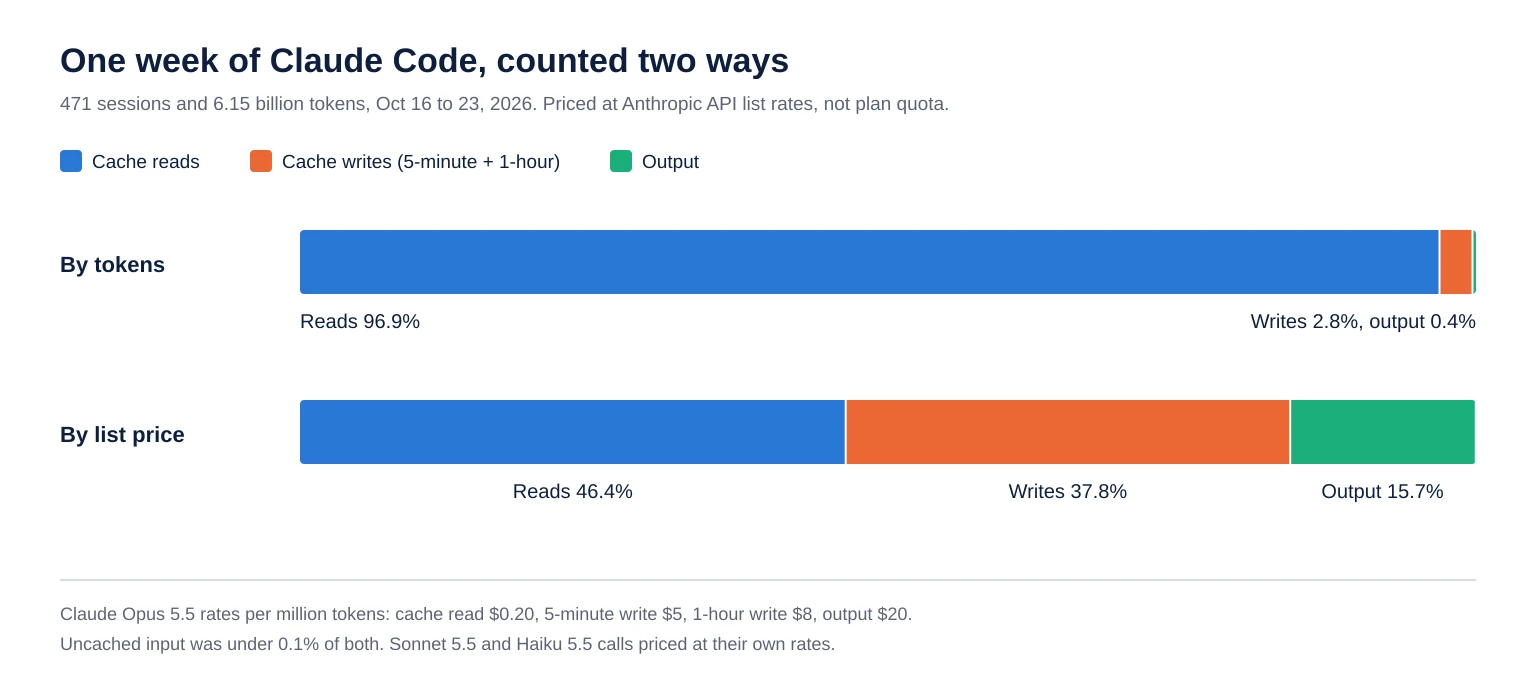
The practical change is what you watch. A hit rate of 97% says little about cost. The cache write share says a lot, and it moves when your habits change.
What is a cache break, and where did mine come from?
The plugin flags any call that writes more than 100,000 tokens it couldn't read from cache. My week had 223 of them, holding 42% of all cache-write tokens. When I lined each one up against the previous call in the same transcript, 209 of the 223 (94%) came after the cache had expired from idle time.
A cache entry has a time-to-live. Every read refreshes it, and once it lapses, the next request has to write the whole prefix again. In my transcripts the two kinds of context use different windows: 98% of main-session cache writes were 1-hour writes, and 100% of subagent cache writes were 5-minute writes. That is what my logs show on Claude Code 2.1.301 through 2.1.305, not a documented guarantee, so check the cache_creation fields in your own transcripts before you rely on it.
So I sorted the 223 big writes by what happened just before each one:
| What came before the rewrite | Breaks | Write tokens | List price |
|---|---|---|---|
| A main session sat idle for over an hour | 72 | 38.3M | about $307 |
| A subagent had finished, then got a follow-up message over 5 minutes later | 92 | 19.5M | about $76 |
| A subagent waited over 5 minutes on its own tool call | 42 | 9.9M | about $44 |
| The prefix changed while the cache was still live | 13 | 2.3M | about $14 |
| Other (first call of a transcript, mixed cases) | 4 | 1.0M | about $5 |
The prefix-change row is the one people usually blame: an edited system prompt, a changed tool list, a model switch. It was 13 breaks out of 223. Expiry was 209.
At list price, those 223 rewrites cost about $446, or 18% of my week. That is 223 calls out of 21,449.
Why do subagents cost more than their token count suggests?
In my week, 688 subagent runs made up 32% of all tokens but 64% of all cache writes. A new subagent read a median 17,900 tokens from cache on its first call, then wrote a median 55,000 more. The bigger cost came later: 92 times, I sent a follow-up to a subagent that had already finished, after its 5-minute cache had expired.
Start with the first call, because every subagent pays it. The shared part of the prompt was already cached (78% of first calls read more than 10,000 tokens from cache), but the subagent's own brief and context were new, and across 688 runs those first-call writes added up to 39 million tokens, 23% of all my cache writes.
The follow-ups are the part I didn't expect. When a subagent finishes and you message it again, my transcripts show Claude Code continuing the same subagent with all of its context. If that follow-up arrives more than five minutes later, the cache is gone, and the whole subagent context gets written back. In my week, the median rewrite from a revived subagent was 178,000 tokens, more than three times the median cost of starting a fresh one. The median gap before those follow-ups was 9.3 minutes, so these weren't hour-long pauses. They were the ordinary rhythm of a coordinator getting to a subagent's result a few minutes late.
Long tool calls matter less than I assumed. 42 subagent breaks came after the subagent waited more than five minutes on its own command, a build or a test run or a sleep, which cost about $44 for the week. That's real, but it's about 60% of the follow-up cost, and both are small next to the main-session row.
What does walking away from a long session cost?
72 of my main-session cache breaks came after more than an hour idle, and they cost about $307 at list price, 12% of my week. 57 of them were me coming back to a session, after a median gap of 11 hours, with a median rewrite of 489,000 tokens. Typing "continue" sends the whole context again as a 1-hour write, at twice the base input price.
The math is blunt. A session that has grown to 500,000 tokens of context costs about $4 in cache writes the moment you resume it the next morning, before the model does anything new. Do that across several open sessions and it adds up, while every individual turn still looks cheap.
The other 15 weren't a person coming back. 9 followed a foreground command that ran for more than an hour, so the session's own cache expired while it waited, and 6 followed a background task notification that woke an idle session.
You have two simple options before you step away from a big session. End it with a short written handoff and start fresh, so the next session begins small. Or compact it while the cache is still warm, so what gets rewritten later is a summary instead of the full history. I didn't measure the compaction option here; it follows from the price table, since a compaction run while the cache is warm reads the history at the cheap rate.
What does this tell you about the "usage draining 5x" reports?
Nothing conclusive, and I want to be plain about that. As of October 23, 2026, Anthropic's first reply was "No changes on our end," and its latest says the team is investigating. My numbers count tokens and price them at API rates, and Anthropic hasn't published how plan limits weigh cache reads, cache writes and output. A token mix can't prove why a plan meter moved.
What the transcripts do give you is a baseline. If your usage suddenly feels heavier, run the report and the script on this week and on a week that felt normal, and compare the cache write share, the number of big breaks, and the subagent count. If those jumped, your habits moved. If they didn't, the change is somewhere you can't see from your own machine, and that's useful to know too. Claude Code's /usage command shows the plan side of the picture; the transcripts show the mix underneath it.
What I'm changing
The first three changes come straight from rows in the tables above:
After a long break, I start fresh with a handoff instead of resuming a huge context. That was 57 resumes and most of the $307 main-session row.
Follow-ups to a finished subagent go out within five minutes, or go to a fresh subagent with a short brief. A revived subagent rewrote a median 178,000 tokens; a fresh one wrote 55,000. That was 92 breaks and about $76.
Long waits run in the main session, not inside a subagent. The main session keeps a 1-hour cache in my logs; a subagent keeps five minutes. That was 42 breaks and about $44.
I watch the cost share, not the hit rate. The weekly check is the script above, and the line I read first is cache writes.
The whole measurement takes a minute: install the plugin, run /session-report, then run python3 weigh.py 7. Your mix won't look like mine. I run long sessions and a lot of parallel subagents, so expiry dominates my week. Yours may not, but you'll know which row to fix first.